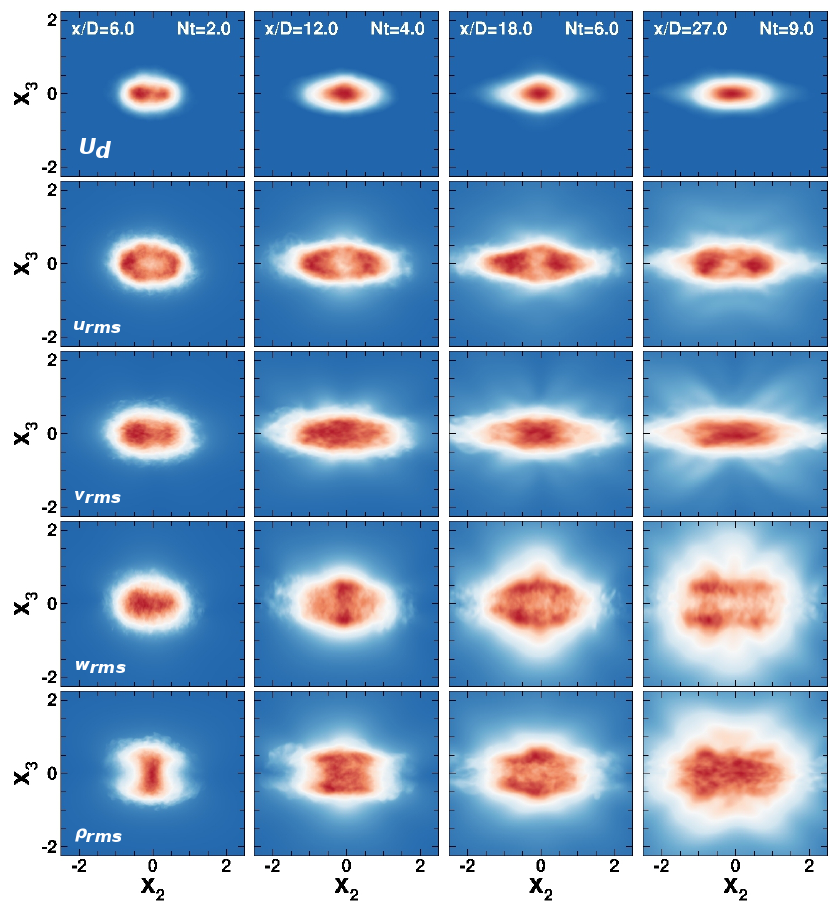
This image shows how qualitative evolution of the mean defect velocity, turbulence intensities and density perturbation in the wake. The top row shows the defect velocity, the 2nd row the streamwise velocity rms, the 3rd row the spanwise velocity rms, the 4th row the vertical velocity rms and the bottom row shows the density rms. All plots have been normalized by the maximum value so that dark red indicates a large value and blue indicates zero. Here we can observe the spreading of the wake in the horizontal direction as well as the restriction in the vertical direction. The signature of internal wave activity can aslo be seen in the rms values.
| Image navigator: | First | Previous | Next | Last | 10 of 10 |